



Texas, Not Florida, Has the Highest Homeowners Insurance Bills. Louisiana Pays More Than 1% of Home Value Every Year.


 FACT-CHECKEDFACT-CHECKED
Homeowners insurance is the line in your mortgage payment you're least likely to shop, and it's climbing fast. AmeriSave's funded loans this year put the highest median premium in Texas, not Florida, with Louisiana paying more than 1% of home value every year. Here's the state-by-state picture, and what to do with it.
Key Takeaways
- Texas has the highest median homeowners premium in the data at $2,978 a year; Florida ranks sixth at $2,521.
- Louisiana pays 1.11% of home value a year in premiums and Oklahoma pays 1.01%, the only two states above 1%.
- The premium on a loan application runs 8.5% below the actual policy on first liens, so treat it as a floor, not the bill.
- In a high-risk flood zone, homeowners plus flood coverage runs about $3,640 a year, roughly double a home with neither risk.
- Private flood policies make up 25.8% of flood policies in the data and cost about 22% less than the overall flood median.


The Premium on Your Loan Application Is a Floor, Not the Bill
An escrow account is a thermostat that gets set once. The premium on your loan application becomes the number your servicer collects, the servicer renews whatever policy is on file, and the annual escrow analysis that reveals an increase arrives after the money has already gone out the door. Nothing in that chain asks you to shop. Across nearly 30 years in mortgage operations and compliance, the pattern I've seen most often is a homeowner who never saw a reason to shop at all, because the process never put the decision in front of them.
That's the thesis of this article, and the data supports it. Across loans AmeriSave closed this year, the median homeowners premium is $1,800 a year, or 0.46% of the home's value, and a premium appears on 99.8% of loans. That application premium is also a floor. A one-off check this year compared application premiums against the transcribed policies behind them: the two matched for at least half of loans, but the application median ran 8.5% lower on first liens and 16% lower on home equity lines and home equity loans. If you're budgeting from the application, you're budgeting from the low end.
The second half of the thesis is geographic. The national conversation treats homeowners insurance as a Florida story. In the data, Florida ranks sixth by median premium. Texas, Louisiana, Oklahoma, and Nebraska all rank above it, and measured as a share of home value, Louisiana and Oklahoma are the only states where the median homeowner pays more than 1% every year. Nobody is writing about them.

Homeowners Insurance Cost by State: Texas Leads, Florida Is Sixth
If you've searched for the average homeowners insurance cost, you've seen a national figure. The state spread is what you need, and the median is the cleanest way to show it because it ignores the outliers at both ends. Figure 1 shows the top and bottom states against the national $1,800 line, and the full state table at the end of this section carries every state with enough loans to report, with flood-zone and disaster exposure alongside the premium.
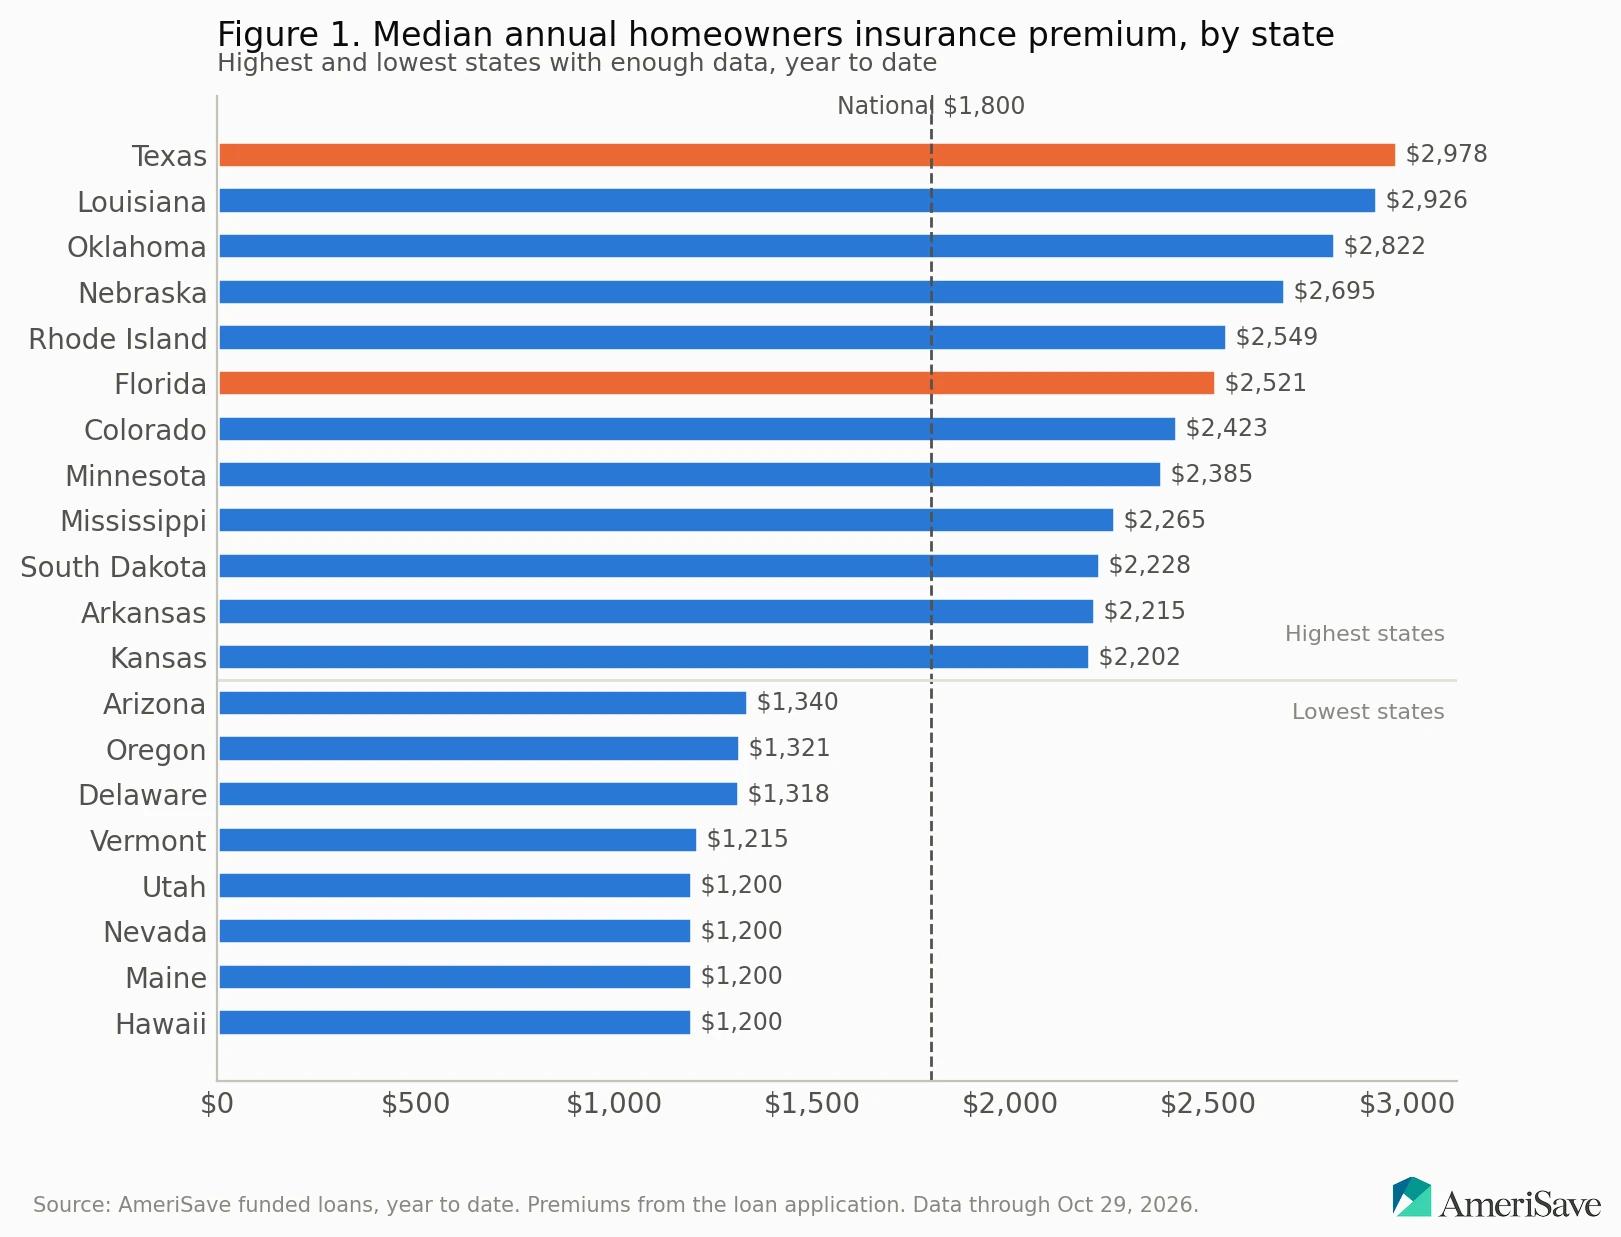
Four things stand out. Texas leads at $2,978, with Louisiana and Oklahoma close behind, and none of the three is the state the headlines name. The second surprise is the Plains. Nebraska at $2,695, South Dakota at $2,228, Arkansas at $2,215, and Kansas at $2,202 all sit well above the national median; these are severe-storm states, not coastal ones. Third, Rhode Island at $2,549 and Colorado at $2,423 are expensive in dollars but modest as a share of value, at 0.45% and 0.42%, which is the difference between an expensive house and an expensive risk. Fourth, the floor is flat: Hawaii, Maine, Nevada, and Utah all sit at a $1,200 median, with Vermont, Delaware at $1,318, Oregon at $1,321, and Arizona at $1,340 just above.
New York is not in the data, so it doesn't appear in any of these rankings.
| State | Median annual homeowners premium | Premium as % of home value | Share of homes in a high-risk flood zone | Share in a county with a disaster declaration | Share in a county with a hurricane declaration |
|---|---|---|---|---|---|
| Texas | $2,978 | 0.74% | 3.4% | 57.3% | 25.4% |
| Louisiana | $2,926 | 1.11% | 20.4% | 23.7% | 23.7% |
| Oklahoma | $2,822 | 1.01% | 2.3% | 64.9% | 0.0% |
| Nebraska | $2,695 | 0.84% | 1.8% | 62.2% | 0.0% |
| Rhode Island | $2,549 | 0.45% | 3.4% | 80.7% | 0.0% |
| Florida | $2,521 | 0.61% | 11.2% | 84.5% | 82.8% |
| Colorado | $2,423 | 0.42% | 0.9% | 0.0% | 0.0% |
| Minnesota | $2,385 | 0.64% | 0.3% | 13.5% | 0.0% |
| Mississippi | $2,265 | 0.88% | 5.5% | 64.8% | 6.4% |
| South Dakota | $2,228 | 0.69% | 5.7% | 18.6% | 0.0% |
| Arkansas | $2,215 | 0.79% | 0.8% | 56.4% | 0.0% |
| Kansas | $2,202 | 0.77% | 1.5% | 0.0% | 0.0% |
| Montana | $2,146 | 0.38% | 2.0% | 0.0% | 0.0% |
| Alabama | $2,100 | 0.70% | 1.8% | 0.0% | 0.0% |
| Missouri | $2,061 | 0.67% | 1.9% | 30.6% | 0.0% |
| North Dakota | $2,001 | 0.60% | 0.0% | 0.0% | 0.0% |
| Georgia | $1,992 | 0.51% | 1.5% | 26.8% | 26.7% |
| Wyoming | $1,988 | 0.51% | 1.5% | 0.0% | 0.0% |
| Iowa | $1,978 | 0.75% | 1.1% | 47.0% | 0.0% |
| Connecticut | $1,970 | 0.40% | 2.1% | 2.3% | 0.0% |
| Kentucky | $1,931 | 0.60% | 2.3% | 70.8% | 0.0% |
| Massachusetts | $1,899 | 0.31% | 2.7% | 24.2% | 0.0% |
| Illinois | $1,884 | 0.55% | 1.2% | 43.7% | 0.0% |
| Alaska | $1,754 | 0.38% | 0.0% | 3.3% | 0.0% |
| Tennessee | $1,752 | 0.46% | 1.3% | 52.6% | 6.9% |
| New Jersey | $1,746 | 0.28% | 3.9% | 0.0% | 0.0% |
| South Carolina | $1,727 | 0.47% | 4.0% | 62.3% | 62.3% |
| California | $1,704 | 0.24% | 2.3% | 26.3% | 0.0% |
| Maryland | $1,632 | 0.37% | 1.0% | 0.0% | 0.0% |
| Indiana | $1,620 | 0.55% | 0.5% | 19.7% | 0.0% |
| North Carolina | $1,596 | 0.42% | 1.6% | 45.1% | 45.1% |
| Washington | $1,596 | 0.26% | 2.1% | 63.2% | 0.0% |
| Virginia | $1,584 | 0.35% | 2.8% | 6.3% | 6.3% |
| Wisconsin | $1,502 | 0.39% | 0.8% | 45.6% | 0.0% |
| Michigan | $1,500 | 0.51% | 1.1% | 49.8% | 0.0% |
| New Hampshire | $1,500 | 0.29% | 1.1% | 0.0% | 0.0% |
| New Mexico | $1,428 | 0.39% | 4.7% | 27.2% | 0.0% |
| Ohio | $1,409 | 0.49% | 1.4% | 13.7% | 0.0% |
| West Virginia | $1,397 | 0.49% | 4.3% | 51.2% | 4.0% |
| Idaho | $1,386 | 0.29% | 2.2% | 0.0% | 0.0% |
| District of Columbia | $1,347 | 0.21% | 0.0% | 0.0% | 0.0% |
| Pennsylvania | $1,342 | 0.41% | 1.7% | 1.6% | 1.6% |
| Arizona | $1,340 | 0.29% | 1.1% | 0.0% | 0.0% |
| Oregon | $1,321 | 0.26% | 2.4% | 0.0% | 0.0% |
| Delaware | $1,318 | 0.33% | 1.2% | 0.0% | 0.0% |
| Vermont | $1,215 | 0.29% | 3.2% | 66.1% | 0.0% |
| Hawaii | $1,200 | 0.13% | 7.9% | 84.2% | 0.0% |
| Maine | $1,200 | 0.30% | 2.3% | 80.5% | 0.0% |
| Nevada | $1,200 | 0.24% | 1.8% | 0.0% | 0.0% |
| Utah | $1,200 | 0.20% | 0.4% | 0.0% | 0.0% |
The States Paying More Than 1% of Home Value Every Year
Dollars tell you what the check is. Share of home value tells you what the risk is, because insurers price to expected loss, and Louisiana's $2,926 median on a modest house says more about the hazard than the same premium on a large one. Figure 2 ranks the states this way, and the order changes.
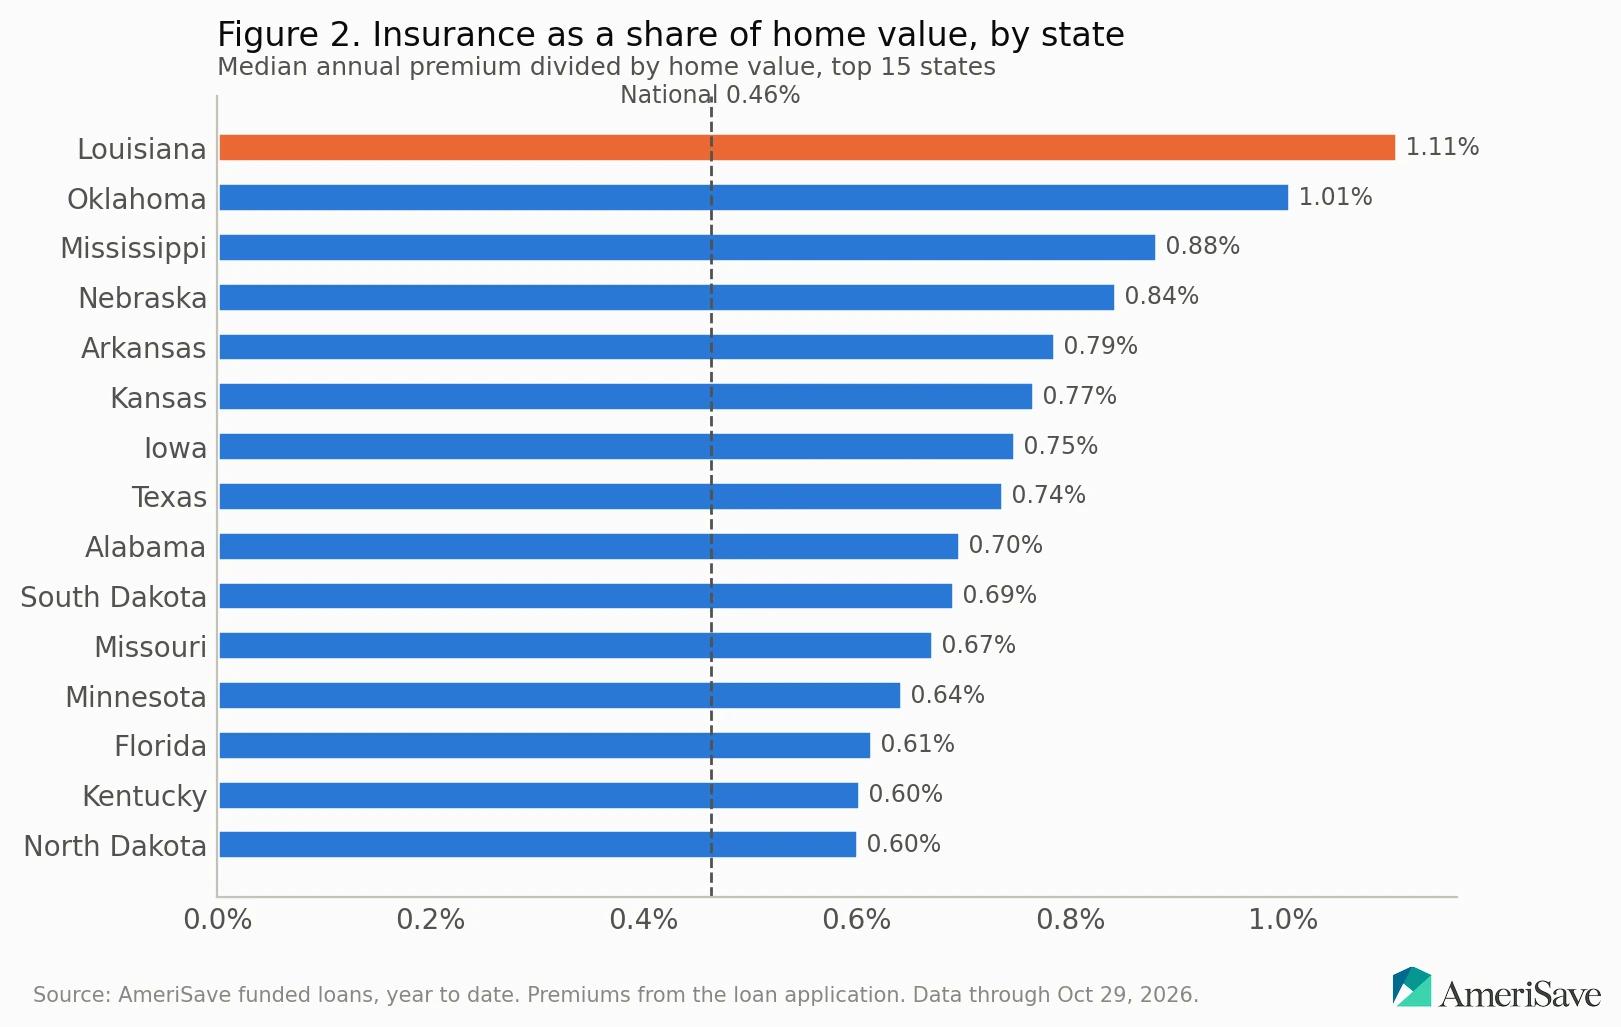
Louisiana leads at 1.11% of home value. Oklahoma follows at 1.01%, then Mississippi at 0.88%, Nebraska at 0.84%, Arkansas at 0.79%, Kansas at 0.77%, and Texas at 0.74%. Florida, at 0.61%, sits below all seven. At the other end, Hawaii's $1,200 median is 0.13% of home value, Utah's is 0.20%, Nevada's is 0.24%, and Maine's is 0.30%.
The Florida framing is incomplete rather than wrong. Nearly nine in ten Florida homes in the data sit in a county with a declared disaster in the three years before funding, and 82.75% sit in a county with a declared hurricane. South Carolina is at 62.30% for hurricanes, North Carolina 45.12%, Georgia 26.70%, and Texas 25.35%. Florida has earned its coverage. But the premium per dollar of value in Louisiana, Oklahoma, Mississippi, Nebraska, Arkansas, Kansas, and Texas is as bad or worse, and if you own in one of those states, the national crisis story has been leaving you out.
Why Homeowners Insurance Keeps Going Up
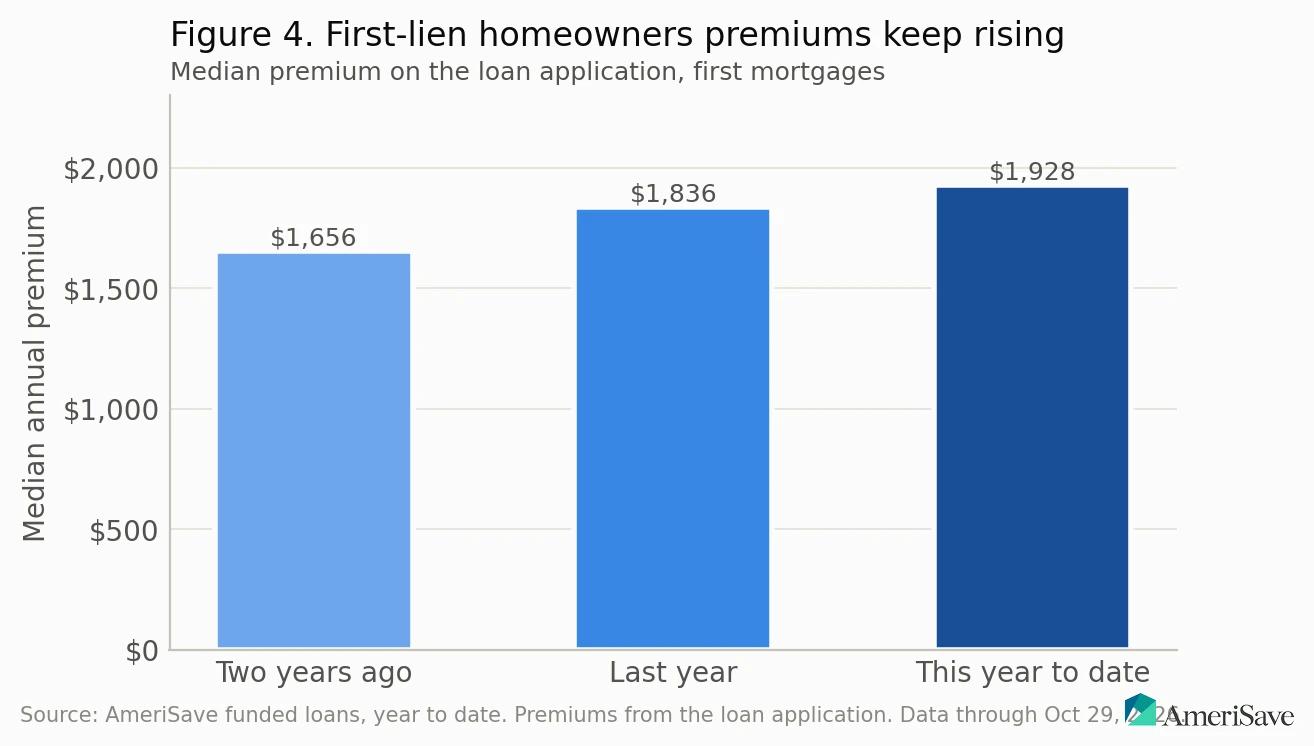
Figure 4 tracks the first-lien median premium by year. First liens are the right series for trend because second-lien premiums were under-recorded before last year. The median went from $1,656 two years ago to $1,836 last year to $1,928 so far this year, up 5.0% over the past year and 16.4% over two years. Those are medians on newly funded loans, not renewal notices, so they're a conservative read on what's happening to any one household's bill.
State by state, the change is noisier, and small states swing. Rhode Island rose 14.3% over the past year, Nebraska 8.7%, Minnesota 7.6%, and California, Wisconsin, and Washington all rose between 7.3% and 7.4%. Mississippi fell 8.3% and Delaware fell 7.1%. Read a single-state change as direction, not as a forecast.
Disaster exposure helps explain the level. Of the homes financed this year, 32.6% sit in a county with a federally declared climate disaster in the prior three years, down slightly from 34.0% last year and up from 28.3% two years ago. Severe storms and tornadoes touch 18.9% of homes, flooding 15.8%, hurricanes and tropical storms 13.5%, wildfire 2.5%, and winter storms 2.0%. These categories overlap, since one county can carry more than one declaration in three years.
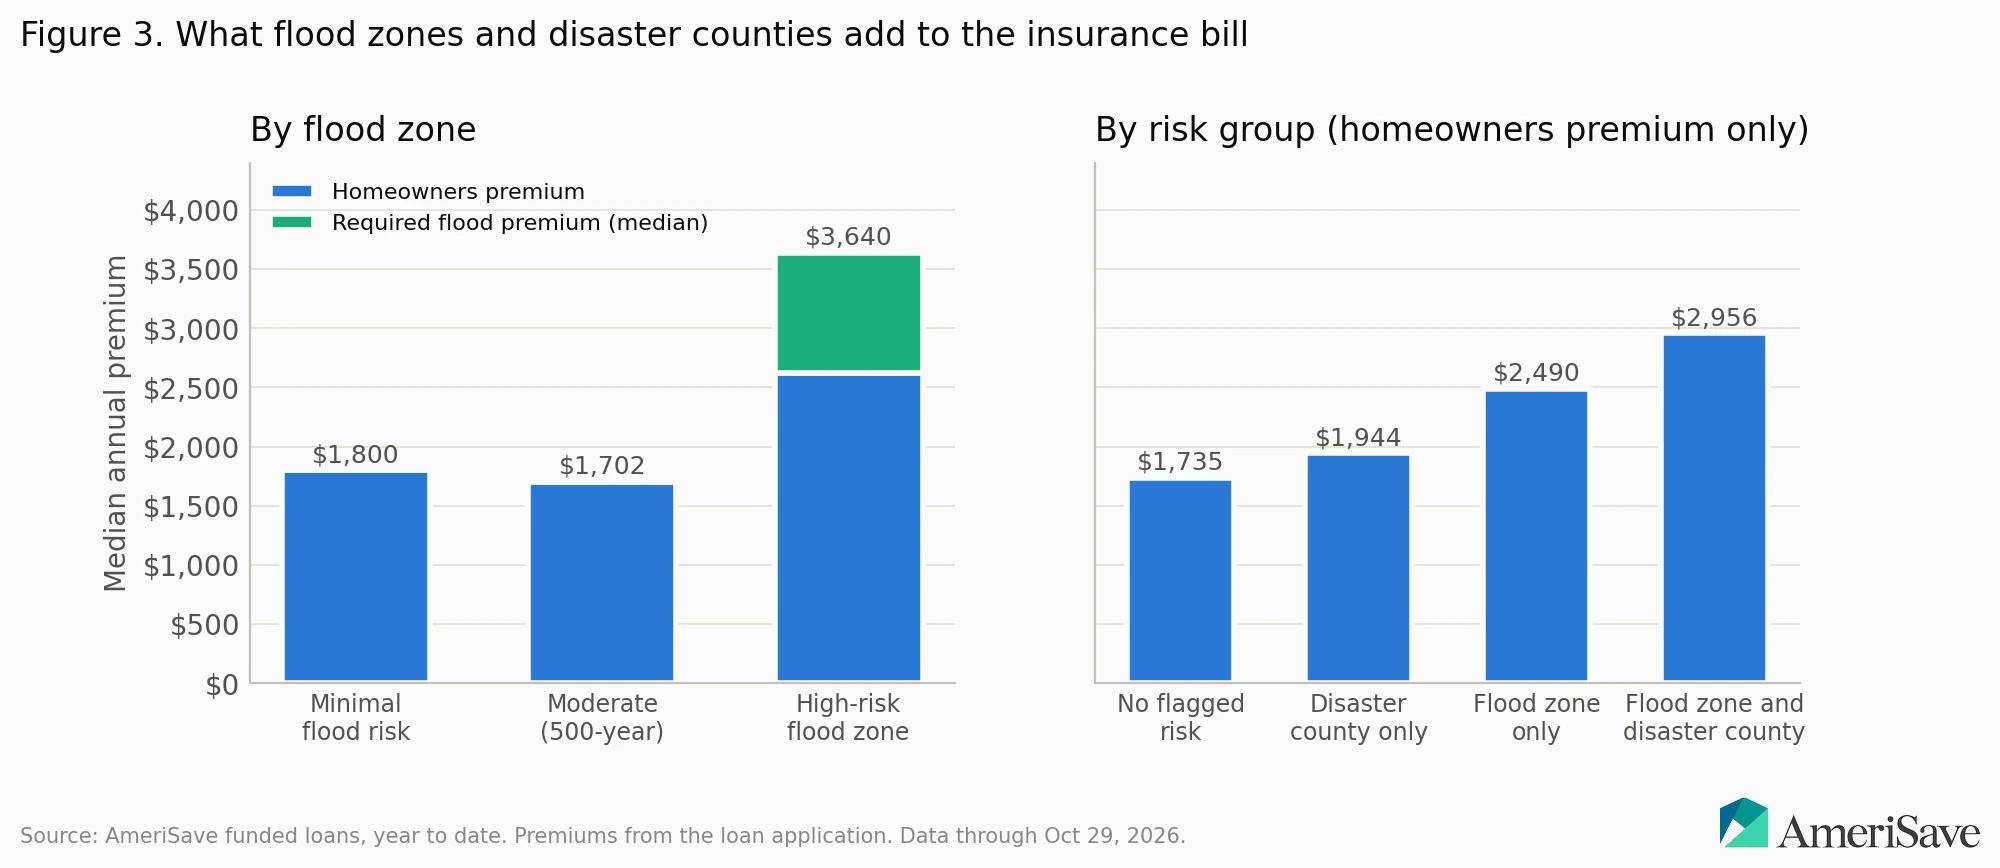
Exposure shows up in the premium. A home in a disaster-declared county but outside a flood zone carries a median premium of $1,944, or 0.51% of value, about 12% more than the $1,735 (0.43%) for a home with neither risk. The wildfire figure is a proxy that counts declared disasters only: California at 15.5% of its loans reflects the Los Angeles County fires in January of last year, while Oklahoma at 36.2% and Missouri at 25.3% reflect spring storm and fire declarations. There's no wildfire risk score on a loan file, and that gap is worth knowing about if you're buying at the edge of a canyon or a forest.
Flood Zones: What the Rule Requires and What It Costs
A Special Flood Hazard Area, in FEMA's definition, is land with at least a 1% chance of flooding in any given year, often called the 100-year floodplain, and it's mapped as the A and V zones on a Flood Insurance Rate Map. When a home in one of those zones secures a loan from a federally regulated lender, federal rules require flood insurance as a condition of the loan. The lender's flood determination, not the seller's disclosure and not the listing, decides which zone you're in.
Every loan in the data carries that determination, so the exposure figures are clean. This year 2.84% of financed homes sit in a high-risk zone, compared with 2.81% last year and 2.95% two years ago. Another 5.73% sit in the moderate-risk 500-year floodplain, where the rule doesn't require coverage.
The state pattern is concentrated. Louisiana has 20.4% of its financed homes in a high-risk zone and Florida has 11.2%. Mississippi is at 5.5%, New Mexico 4.7%, West Virginia 4.3%, and South Carolina 4.0%. Hawaii at 7.9% and South Dakota at 5.7% are high but on small bases, so hold them loosely.
Now the cost, which Figure 3 lays out by risk group. The homeowners premium alone in a high-risk A zone runs $2,622 a year, 0.69% of value, about 46% above the $1,800 in minimal-risk zones. Then add the flood policy. Among high-risk loans with a priced policy, the median flood premium is $1,018 a year. Together that's about $3,640 a year, roughly double the $1,735 for a home with neither flood nor disaster exposure. Homes that carry both a flood zone and a disaster-county designation pay a median $2,956 in homeowners premium alone, 0.74% of value, about 70% more than the no-risk group, before a dollar of flood coverage.
Compliance is high where the rule applies. Of high-risk first liens, 93.7% have flood insurance on record and 93.3% escrow it, at a median $1,004. For home equity lines and home equity loans, the on-record share is 86.1% this year with a median premium of $1,025, up from 52.1% last year. That jump is a reporting change, since flood policies on second liens are now transcribed into the file; it doesn't mean coverage changed.
Two smaller lines round out the picture. A separate wind or hurricane policy appears at closing on 0.33% of loans, at a median $2,563 a year. And 1.36% of transcribed homeowners policies come from an insurer of last resort, meaning a state FAIR Plan, Citizens, or a wind pool, led by North Carolina, Florida, California, and Texas. Percentage deductibles, where the deductible is a share of the dwelling coverage rather than a flat dollar figure, appear on 12.3% of transcribed policies, and on a storm claim they can make the out-of-pocket far larger than the flat deductible you may be picturing.
Private Flood Insurance vs NFIP: Ask for the Second Quote
The National Flood Insurance Program is managed by FEMA and sold through a network of private insurance companies as well as directly, which is why most buyers assume the federal policy is the only policy. The rule that requires flood insurance also requires a regulated lender to accept a private flood policy that meets the statutory definition of private flood insurance, and regulators gave lenders a compliance aid: a policy that states on its face that it meets that definition can be accepted without further review.
In the data, 25.8% of transcribed flood policies are private rather than NFIP, and the private median is $791 a year, about 22% below the $1,018 overall flood median. One in four homeowners in a flood zone already made that choice. The rest took the default.
The recommendation is a procedure, not an endorsement of any insurer. If a flood determination comes back high-risk, ask your agent for a private flood quote alongside the NFIP quote before you accept either one. Compare the coverage limits, the replacement-cost terms, and the waiting period, not only the premium. A private policy without the statutory language may still be acceptable after your lender reviews it; one that carries the language removes the question.
How Escrow Hides the Increase, and How to Use the Analysis Instead
Under Regulation X, a servicer runs an escrow analysis once a year, projects the next twelve months of tax and insurance disbursements, and may hold a cushion of up to one-sixth of those annual disbursements. If the account comes up short, the servicer may collect the shortage in a lump sum or spread it over at least twelve months. So an insurance increase reaches you twice: once in the higher payment going forward, and again as the shortage from the months the old payment undercollected.
That timing is the problem. The analysis is a rear-view mirror. By the time it tells you the premium went up, the servicer has already paid the renewal, and the only decision left is how to repay. The policy decision, whether to keep that insurer at all, was made for you by inertia.
Nothing in the escrow rules binds you to the insurer on file. You can switch at any time; you notify the servicer, and it pays the new policy out of escrow going forward. The practical rule follows from that: re-quote your coverage every time the escrow analysis arrives, not every few years. The analysis is already an annual event. Make the quote part of it.
Take the first-lien trend as the worked example. The median premium rose from $1,656 two years ago to $1,928 this year. A homeowner who hasn't re-quoted since closing two years ago has absorbed that 16.4% through two escrow analyses, each one presented as a shortage to repay rather than a policy to shop. The system did exactly what it's built to do; it just isn't built to protect the premium.
This belongs in two places in the mortgage process. If you're weighing a rate-and-term refinance, pair it with an insurance re-quote in the same month, since both change the same payment and you'll be setting up a new escrow account anyway. If you're buying, ask for the flood determination early in preapproval, so a high-risk zone shows up before you're committed to the house rather than at the closing table. Either way, finish with a full payment review that includes the escrow line, not just principal and interest.
Methodology
Source. The figures come from AmeriSave's funded-loan records: every loan funded this year, all products, assigned to the property state. Homeowners premiums are the annual dollars on the final loan application. Flood zone comes from the flood determination on every loan. Disaster exposure uses the FEMA disaster declaration list AmeriSave maintains for re-inspections. The private flood share, the insurer-of-last-resort share, the deductible share, and the application-versus-policy check use homeowners and flood policies transcribed from loan documents, which began this year and cover most loans but not all of them.
Definitions. Median homeowners premium is the midpoint of annual application premiums, shown in dollars and as a share of home value. A Special Flood Hazard Area is FEMA's high-risk flood zone, where flood insurance is required; the moderate-risk share is homes in the 500-year floodplain. A disaster county is a county where a FEMA climate disaster declaration began in the three years before the funding date, and the hazard shares split that figure by the hazard named in the declaration, so they overlap. Risk groups are both flood zone and disaster county, flood zone only, disaster county only, and neither. First-lien premium rows are shown separately for year comparisons because second-lien premiums were under-recorded before last year. The median flood premium covers high-risk loans with a priced flood policy.
Period. This year to date, with data through October 29, compared with the two full prior years. The open year is republished until it closes, and hurricane season runs through November, so the Florida figures in particular will move at the year-end refresh.
Publication floor. A state is ranked or named only with at least 30 loans in each compared year; smaller cells stay in the national row.
Limitations. Application premiums are floors: where a transcribed policy exists, the application figure matches it at least half the time, but its median runs about 8.5% lower on first liens and about 16% lower on home equity lines and home equity loans. The FEMA list lags new declarations, so this year's exposure is undercounted. Wildfire is counted by declaration only; no loan carries a wildfire risk score. New York is not in the data. Medians move with the mix of states, products, and home values, not only with premiums. And the figures describe homes AmeriSave financed, which aren't all homes or all homeowners in a state.
The Bottom Line
The premium on your application is a floor, not the bill. The servicer renews what's on file, and the escrow analysis reports the increase after the money is gone. Each of those is a designed feature of the process, and together they explain why insurance is the least-shopped line in the payment.
The state rankings don't match the headlines. Texas has the highest median bill, Louisiana and Oklahoma are the only states paying more than 1% of home value every year, and the Plains states carry premiums nobody is writing about. Flood coverage is required in a high-risk zone, but the federal policy isn't the only one the rule allows, and the private policies in the data run about 22% cheaper.
Re-quote at every escrow analysis. Ask for the private flood quote before you accept the default. And when you're changing the loan, whether through a rate-and-term refinance or a purchase preapproval, run the payment review all the way through escrow, because that's where the increase has been hiding. A rate quote from AmeriSave paired with a fresh insurance quote in the same week gives you both halves of the payment at once, which is the only way to see the whole number.
AmeriSave internal funded-loan data, Climate Risk and Insurance Report, all loans funded year to date, data through October 29, 2026. Internal, not publicly available.
Consumer Financial Protection Bureau, Regulation X escrow accounts (12 CFR 1024.17), supports the one-sixth cushion limit and the shortage repayment rules:
FEMA, Flood Zones glossary, supports the Special Flood Hazard Area definition and the 1% annual chance standard:
FEMA, National Flood Insurance Program, supports the description of how the NFIP is managed and sold:
Federal Register, Loans in Areas Having Special Flood Hazards, Private Flood Insurance, final rule (84 FR 4953, February 20, 2019), supports the mandatory purchase requirement and the required acceptance of qualifying private flood insurance:
FEMA, Disaster Declarations Summaries (OpenFEMA), supports the federally declared disaster concept used for county exposure:


Casey brings 28 years of comprehensive mortgage industry experience spanning operations, compliance, and capital markets to AmeriSave. She has led teams across disclosure, compliance, processing, underwriting, and post-closing while navigating three market crashes since 1998, and previously served as Managing Partner at Groundwork Consulting LLC. Based in Texas, specializes in risk mitigation, pricing integrity, and translating complex market dynamics into actionable borrower guidance.
Frequently Asked Questions
Texas has the highest median homeowners premium in the data at $2,978 a year, or 0.74% of home value, and the reasons stack. A quarter of financed Texas homes, 25.35%, sit in a county with a declared hurricane in the prior three years, and the state also carries severe-storm, tornado, and hail exposure across its interior, so the whole state is priced for weather rather than a single coast. Texas is also among the leading states for insurer-of-last-resort policies in the data. If you own there, the practical move is the same as anywhere: re-quote at every escrow analysis, and compare the share-of-value figure, not only the dollar premium, when you weigh one house against another.
Ask for the flood determination early, during preapproval rather than at closing. The lender orders a determination on every loan, and that document, not the seller's disclosure or the listing, is what decides whether flood insurance is required. A Special Flood Hazard Area is land with at least a 1% annual chance of flooding, mapped as the A and V zones on FEMA's Flood Insurance Rate Maps, and you can look up an address on FEMA's flood maps yourself before you write the offer. In the data, 2.84% of financed homes fall in a high-risk zone nationally, but the share is 20.4% in Louisiana and 11.2% in Florida, so in those states check every address.
Yes, in most cases. The rule that requires flood insurance in a Special Flood Hazard Area also requires a federally regulated lender to accept a private flood policy that meets the statutory definition of private flood insurance, and a policy that states on its face that it meets that definition can be accepted without further review. In the data, 25.8% of transcribed flood policies are private, and their median premium is $791 a year, about 22% below the $1,018 overall flood median. Ask for both quotes before you accept either, and compare coverage limits, replacement-cost terms, and waiting periods along with the price, since the cheaper policy isn't automatically the better one.
Yes, as long as the new policy meets the coverage requirements in your mortgage documents, which generally means enough dwelling coverage to protect the lender's interest, with the lender named as mortgagee. Nothing in the escrow rules locks you to the insurer on file. You can switch at any time; you notify the servicer, provide the new declarations page, and the servicer pays the new premium out of escrow going forward. The one timing point to watch is the renewal: switch before the old policy renews, so the servicer doesn't pay a premium you then have to chase back. Re-quoting when the annual escrow analysis arrives keeps that timing simple.
Among high-risk loans in the data with a priced policy, the median flood premium is $1,018 a year, and 93.3% of high-risk first liens escrow it, at a median of $1,004. That sits on top of a homeowners premium that's already higher in a flood zone: $2,622 a year in high-risk A zones, about 46% above the $1,800 in minimal-risk zones. Combined, a high-risk home runs about $3,640 a year in the two premiums, roughly double the $1,735 for a home with neither flood nor disaster exposure. Private flood policies in the data run a median $791, so the second quote can narrow that gap.
Your servicer pays the higher renewal from escrow, and the increase shows up at the next annual escrow analysis as two things: a higher monthly escrow payment going forward, and a shortage for the months the old payment didn't cover. Under Regulation X, the servicer may hold a cushion of up to one-sixth of annual disbursements, and a shortage can be collected in a lump sum or spread over at least twelve months. The protection you have is the right to change insurers at any time, so treat the analysis as your annual signal to re-quote, not just a bill to repay.