



After 4 of the Last 6 Fed Rate Cuts, the Rates Borrowers Locked Went Up, Not Down


 FACT-CHECKEDFACT-CHECKED
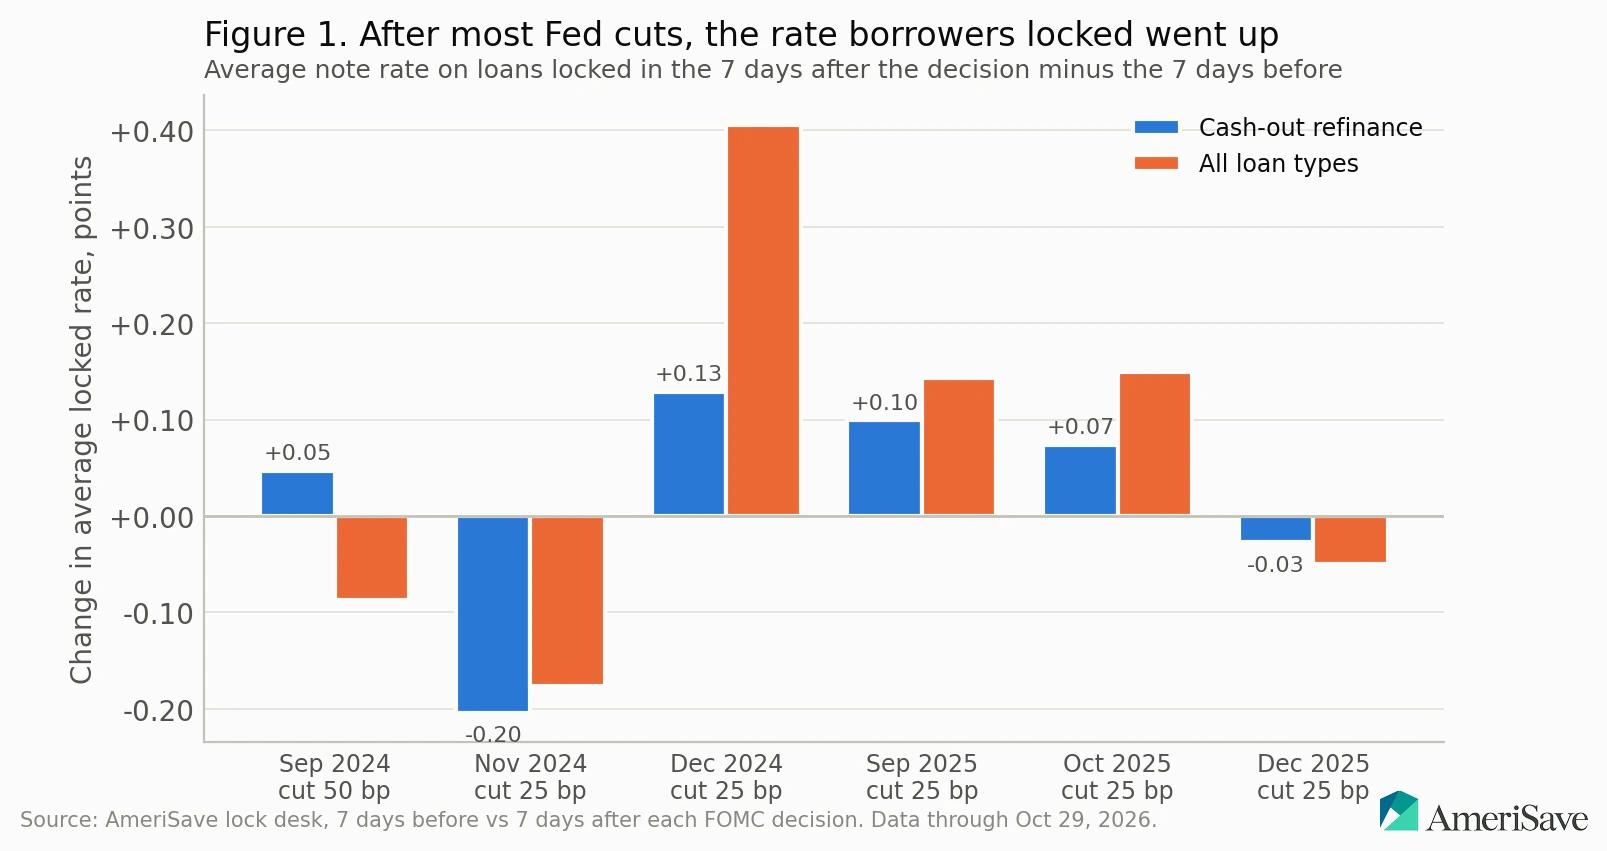
Fed day gets more attention than any other date on a borrower's calendar, and AmeriSave's lock desk data says that attention is misplaced. After four of the last six Fed rate cuts, the average rate on cash-out loans borrowers locked the following week was higher than the week before. The reason is in how mortgages are priced.
Key Takeaways
- The Fed sets an overnight rate; your fixed mortgage rate prices off the ten-year Treasury and mortgage-bond spreads.
- After four of the last six cuts, the average rate on cash-out loans locked the next week went up, not down.
- Lock activity moved less than 4% on average in either direction after cuts, holds, and hikes alike.
- Roughly half to two-thirds of borrowers lock within a day of starting their file, Fed or no Fed, and they've got it right.
- If rate risk keeps you up at night, pay for a float-down rather than paying for it by waiting on a meeting.

Does the Fed Control Mortgage Rates?
Simply stated, no. The Federal Reserve sets a target for the federal funds rate, which is what banks charge each other to borrow overnight. Your thirty-year fixed mortgage is a thirty-year instrument, and nobody prices a thirty-year loan off an overnight rate. It prices off the yield on the ten-year Treasury note plus a spread that investors demand for holding mortgage bonds instead of Treasuries. Both of those pieces move on expectations about inflation and about where the Fed is headed over the next year or two, and they start moving weeks before the committee ever votes.
That mechanism explains the headline. By the time the Fed chair reads the statement at 2:00 PM Eastern, the cut everyone expected is already baked into the ten-year yield and into the rate sheet your loan officer is looking at. What moves the market that afternoon is the surprise, if there's one, and the surprise is usually about the next meeting rather than this one. A cut paired with language that sounds cautious about further cuts pushes the ten-year up, which pushes mortgage pricing up, and a borrower who waited for the "good news" locks a worse rate than the one available the week before. That’s why the rates borrowers locked rose after four of the last six cuts.
I started my career on a lock desk, and I've managed interest rate risk for lenders ever since. The bond market is a forward-looking machine, and a scheduled, telegraphed policy move is the least surprising thing it ever sees.

What Happened to Locked Rates After the Last Six Cuts
The data behind this article comes from AmeriSave's lock desk, and it measures one thing: the average rate on loans borrowers locked in the seven days after each Fed decision compared with the seven days before it. Those are historical averages on locked loans, and they move with the mix of products and borrowers who happened to lock that week. To keep the comparison fair, I use the cash-out refinance product row as the primary series, because it's one product with a consistent borrower profile, and the all-products row as a check. I'm not going to quote rate levels here; the direction and the size of the move tell the story.
The six cuts run from the September cut two years ago, which was the big one at 50 basis points, through the December cut last year. Figure 1 shows the change in the average locked cash-out rate after each cut, with the all-products series alongside it, and the table below adds how lock activity moved over the same seven days.
| Fed cut | Change in the average rate on cash-out loans locked that week (points) | Change in the average rate on all loans locked that week (points) | Change in lock activity, seven days after versus before |
|---|---|---|---|
| September cut, two years ago (50 basis points) | +0.05 | -0.09 | +0.6% |
| November cut, two years ago | -0.20 | -0.18 | +13.2% |
| December cut, two years ago | +0.13 | +0.41 | -32.0% |
| September cut, last year | +0.10 | +0.14 | +10.8% |
| October cut, last year | +0.07 | +0.15 | -4.2% |
| December cut, last year | -0.03 | -0.05 | -6.2% |
Changes are in rate points, so +0.10 means the average rate on cash-out loans locked in the week after was a tenth of a point higher than the week before. Read down the cash-out column and you get the headline: up after four of the six. The all-products column agrees on three of the six, and the one disagreement, the first cut, is small in both directions. The lock activity column rose after three cuts and fell after three, which is the first hint that borrowers aren't treating these meetings as a signal either. Purchase loans moved the same way after the two cuts last fall, up 0.40 and 0.69 points respectively, but purchase volume is a small slice of the data in those windows, so I treat it as a footnote rather than a finding.
Look at the December cut two years ago. The committee cut, and the average rate on all loans locked the following week rose 0.41 points. That after window ran through the holidays, which thins the data and shifts the borrower mix, so I'd discount the size of the move, but the direction fits the mechanism. When a cut arrives alongside guidance that points to fewer cuts ahead than investors had priced, the ten-year sells off, mortgage bonds follow, and rate sheets reprice higher the same afternoon. In a week like that, the cut is old news and the guidance is the news.
The One Cut That Behaved
The November cut two years ago is the exception, and it deserves a look precisely because it's alone. In the week after that decision, the average rate on cash-out loans borrowers locked fell 0.20 points, the all-products average fell 0.18, lock activity rose 13.2%, loans started rose 14.4%, and the share of borrowers locking within a day of opening their file rose 4.4 points. Everything moved the way the Fed-day coverage promises it will.
Why did that one work when the others didn't? The lock data can't answer that on its own. My read, from watching the bond market through plenty of these, is that the market had already pushed rates higher going in and the statement gave it nothing new to worry about, so pricing drifted back down on its own. The quarter-point move in the overnight rate had little to do with it. I'd love to tell you there's a way to spot that setup in advance, and there isn't one a borrower can act on with confidence. One clean reaction in six is a coin that lands on its edge, and nobody should plan a closing around it.


Mortgage Rates After a Fed Meeting: Does Anyone Actually Change Behavior?
If Fed day were the signal the coverage says it is, you'd expect borrowers to pile in after a cut and hang back after a hike. The lock desk shows nothing of the kind. Across the 30 completed decisions over the past three and a half years, lock activity in the week after a meeting moved less than 4% on average in either direction compared with the week before. Cuts averaged a 3.0% decline, with a median of -1.8%, and activity rose after only three of the six; strip out the holiday-week cut and the average flips to +2.8%. Holds came in at +3.6% on average and +1.8% at the median, up after 10 of 19, while hikes averaged -4.2% with a median of +0.9%, up after three of five. Figure 2 lays these out side by side.
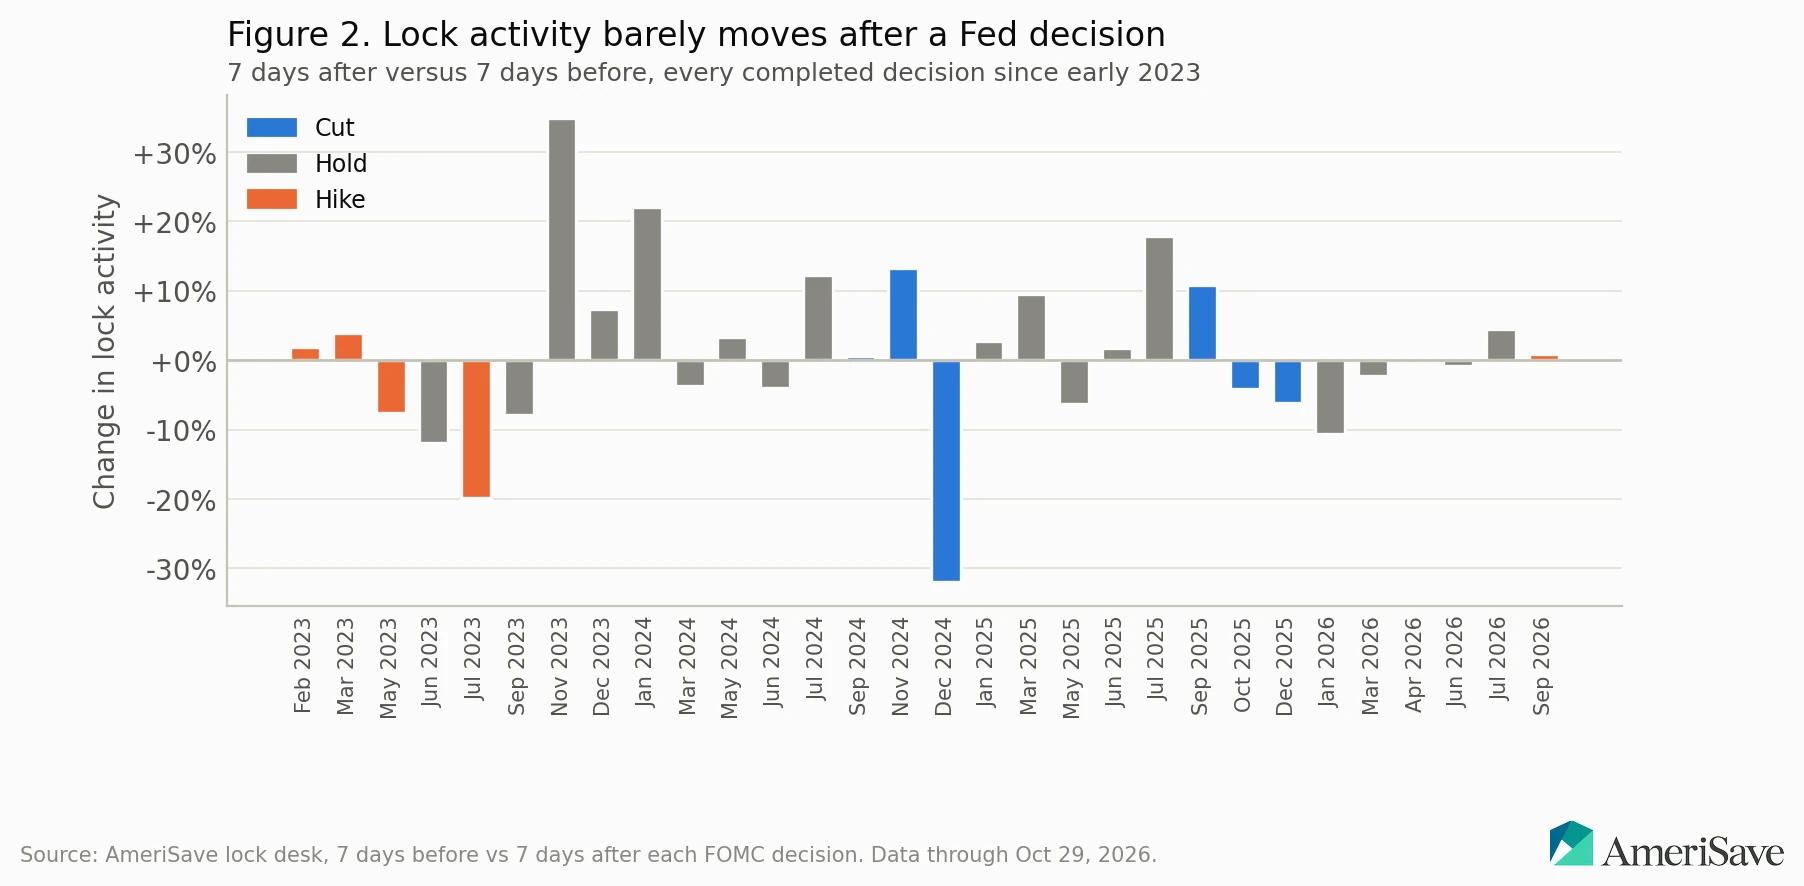
Those numbers are small, and they don't sort the way a Fed-watcher would guess. The largest weekly increases in lock activity on record followed holds, not cuts: +34.8% after a November hold three years ago, +22.0% after a January hold two years ago, and +17.8% after a July hold last year. The largest decreases were -32.0% after the December cut two years ago (that holiday window again), -19.9% after the final hike of the last cycle, and -12.0% after the first pause. If you were handed that list without the labels, you couldn't tell the cuts from the holds. The full decision table below lists every completed decision over the period so you can check that for yourself.
| Meeting | Action | Change in average locked cash-out rate (points) | Change in lock activity, seven days | Share locking within a day, before to after | Average lock period in days, before to after |
|---|---|---|---|---|---|
| Feb, three years ago | Hike | -0.04 | +1.9% | 56.9% to 59.8% | 51.6 to 55.6 |
| Mar, three years ago | Hike | -0.14 | +3.9% | 59.4% to 60.2% | 53.5 to 53.0 |
| May, three years ago | Hike | -0.12 | -7.6% | 56.2% to 57.8% | 52.3 to 51.3 |
| Jun, three years ago | Hold | +0.02 | -12.0% | 55.5% to 56.0% | 51.2 to 53.6 |
| Jul, three years ago | Hike | +0.10 | -19.9% | 52.0% to 52.0% | 58.4 to 57.2 |
| Sep, three years ago | Hold | +0.22 | -7.9% | 52.4% to 49.7% | 56.6 to 56.7 |
| Nov, three years ago | Hold | -0.32 | +34.8% | 52.6% to 50.1% | 53.6 to 51.1 |
| Dec, three years ago | Hold | -0.24 | +7.3% | 50.2% to 54.5% | 52.1 to 51.2 |
| Jan, two years ago | Hold | -0.05 | +22.0% | 66.3% to 64.3% | 50.6 to 50.1 |
| Mar, two years ago | Hold | +0.07 | -3.8% | 66.8% to 63.4% | 50.1 to 50.3 |
| May, two years ago | Hold | -0.23 | +3.3% | 63.3% to 63.4% | 52.3 to 53.9 |
| Jun, two years ago | Hold | -0.04 | -4.0% | 61.6% to 63.1% | 52.8 to 51.1 |
| Jul, two years ago | Hold | -0.25 | +12.2% | 62.0% to 63.6% | 51.2 to 50.2 |
| Sep, two years ago | Cut | +0.05 | +0.6% | 58.7% to 60.4% | 50.9 to 49.7 |
| Nov, two years ago | Cut | -0.20 | +13.2% | 58.0% to 62.4% | 49.5 to 49.7 |
| Dec, two years ago | Cut | +0.13 | -32.0% | 59.3% to 62.0% | 48.5 to 47.7 |
| Jan, last year | Hold | -0.10 | +2.8% | 63.7% to 58.5% | 47.5 to 47.9 |
| Mar, last year | Hold | -0.04 | +9.5% | 59.9% to 61.2% | 46.5 to 46.1 |
| May, last year | Hold | +0.14 | -6.3% | 59.9% to 60.8% | 45.9 to 45.9 |
| Jun, last year | Hold | -0.09 | +1.8% | 57.6% to 57.1% | 44.9 to 44.5 |
| Jul, last year | Hold | +0.04 | +17.8% | 56.6% to 53.6% | 44.2 to 44.5 |
| Sep, last year | Cut | +0.10 | +10.8% | 56.6% to 55.4% | 45.0 to 45.2 |
| Oct, last year | Cut | +0.07 | -4.2% | 60.3% to 58.3% | 44.3 to 45.9 |
| Dec, last year | Cut | -0.03 | -6.2% | 59.0% to 56.5% | 44.7 to 44.7 |
| Jan, this year | Hold | +0.06 | -10.6% | 58.7% to 56.8% | 44.0 to 44.8 |
| Mar, this year | Hold | +0.15 | -2.3% | 56.9% to 54.5% | 44.6 to 44.4 |
| Apr, this year | Hold | +0.20 | -0.1% | 56.6% to 56.3% | 44.6 to 44.6 |
| Jun, this year | Hold | -0.01 | -0.9% | 55.3% to 53.8% | 42.9 to 42.7 |
| Jul, this year | Hold | +0.06 | +4.5% | 53.4% to 55.4% | 41.8 to 41.5 |
| Sep, this year | Hike | +0.07 | +0.9% | 54.0% to 54.2% | 41.8 to 41.2 |
The first day after a meeting is noise in both directions. In the 24 hours after the statement, lock activity jumped 37.1% after a December hold and 26.7% after a March hike, two decisions that were supposed to be bad for borrowers, and it rose 24.3% after the September cut last year. It fell 29.2% after the October cut last year and 25.9% after a July hike. I don't read a pattern into any of that. A lock desk processes whatever files happened to be ready that afternoon, and a day later the week looks ordinary again. When I chart lock volume by calendar day around each meeting, it follows the ordinary weekday cycle, with no surge the day before a decision and none the day after.
How Fast Borrowers Lock
The measure I pay the most attention to is speed to lock: the share of locks placed within a day of the borrower's loan file being created. That share stayed between 49.7% and 66.8% in every single window around every decision, and it moved an average of +0.5 points after cuts, -0.7 after holds, and +1.1 after hikes. Figure 3 shows the before and after share for each decision. Roughly half to two-thirds of borrowers lock within a day of starting their file, Fed or no Fed, and the Fed calendar doesn't dent that number.
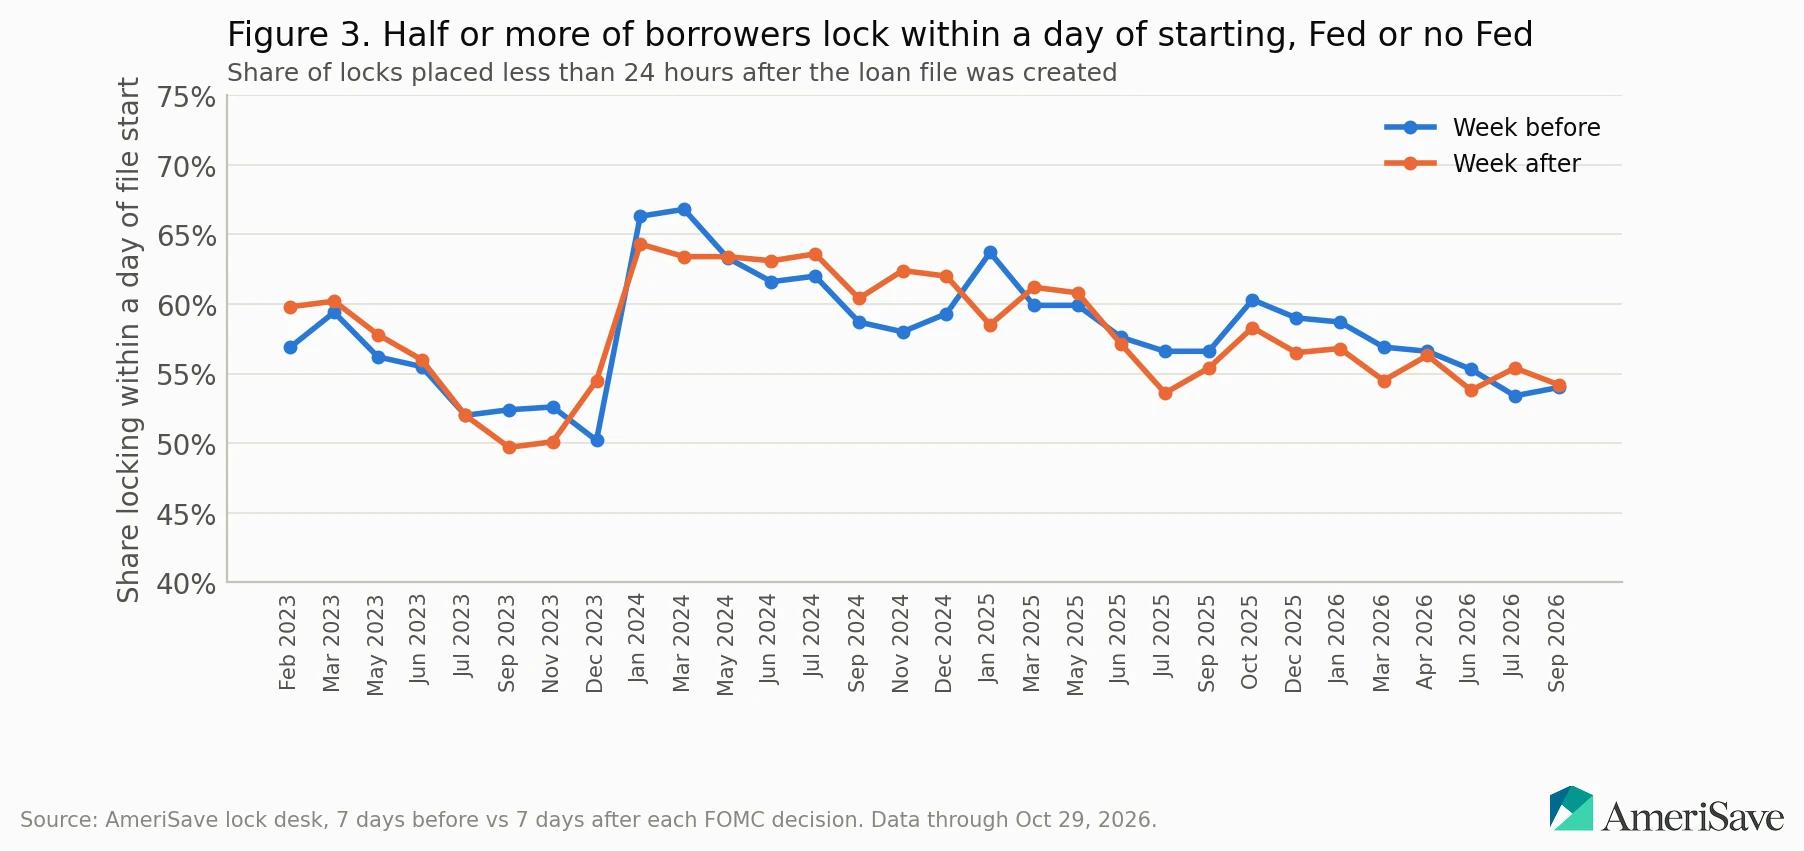
Those borrowers have it right. They're locking when the file is real, when the property is identified or the payoff is in hand and the income documents are in, and they're letting the rate be whatever the market says it is that day. That's how a professional would hedge.
Lock Length Doesn't Move Either
If people were trying to game the meeting, you'd also expect lock periods to stretch or shrink around it. They don't. The average lock period changed 0.0 days after cuts, -0.1 days after holds, and +0.1 days after hikes. The average has drifted from about 54 days three years ago to about 43 days now, and that drift follows product mix, not Fed timing. The one exception came after the 50 basis point cut, when locks of 60 days or more fell from 20.7% of locks to 13.6%. My read is that a few borrowers who'd been floating on long locks decided the big cut was the bottom and shortened up. Given that the cash-out locked rate rose 0.05 points that week, they didn't gain much for the trouble.
What the Most Recent Hike Showed
The last completed decision was the September hike this year, a quarter point in the other direction, and it's a useful test because a hike is supposed to be the scary one. Lock activity rose 0.9% over the week and 14.2% in the first 24 hours. The within-a-day share moved from 54.0% to 54.2%. The average lock period went from 41.8 days to 41.2. The average rate on cash-out loans borrowers locked rose 0.07 points, which is less than the move after two of the cuts. The refinance share of locks slipped from 45.6% to 42.0%, and that last figure is the only one I'd call a reaction: a few borrowers in AmeriSave's data who were refinancing for rate reasons stepped back, while purchase borrowers with contracts and closing dates kept locking because they had to. The October meeting this year isn't in these figures because its after window was still open when the data was pulled.
When to Lock a Mortgage Rate: Time It to Your File, Not the Fed
All of this translates into a decision once you know what a lock actually is. A rate lock is a hedge. You and the lender agree on a price today, and that price holds for a set number of days, typically 30 to 60, as long as the loan closes inside the window and the terms don't change materially. The lender is taking the market risk on your behalf for that period, which is why a longer lock costs a little more than a shorter one. Think of it as insurance for your rate.
A float-down is a rider on that insurance. It lets you take a lower price once, before closing, if the market improves after you lock. You pay for it either as a fee or as a slightly higher starting price, and many versions require the improvement to clear a minimum threshold before you can use it. If the downside scenario keeps you up at night, the one where rates drop a week after you lock, the float-down is the honest way to buy protection against it. Waiting for the Fed meeting is the expensive way, because the data says the meeting is as likely to move your rate against you as for you, and you're exposed the entire time you wait.
So the sequence I'd recommend goes like this. Get the file complete enough to close: income documented, property identified or payoff ordered, appraisal scheduled. Pick a lock period that covers your closing date with a few days to spare, because extensions cost money and a lock that expires is worse than one that ran a week long. Lock that day. If you want a float-down, price it when you lock, and weigh the cost against what a quarter-point improvement would save you per month over the time you plan to keep the loan. Then stop watching the Fed calendar. When you're ready for a fixed-rate purchase or refinance loan, ask AmeriSave about locking with a float-down option as soon as your file is in shape, and let the meeting happen without you.
Methodology
The data comes from AmeriSave's lock desk records, and it covers locked loans only. A lock is a confirmed lock request in the lock desk system. Later price changes, extensions, and cancellations on the same lock aren't counted again, and a relock after a canceled lock counts as a new lock. Loans that never locked are absent from every figure in this article, including the loans-started figure.
Each Fed decision is compared only with itself. The before window is the 168 hours ending at 2:00 PM Eastern on decision day and the after window is the 168 hours starting at that moment, so both windows hold the same weekdays. Holidays inside a window aren't adjusted, which is why the December cut two years ago, whose after window ran through the holidays, is shown both inside and outside the cut averages.
Change in lock activity is locks in the after window against locks in the before window for the same decision, shown as a %. The average locked note rate is a simple average of the rates on the locks in a window. On the all-products row it moves with the mix of products and borrowers who happened to lock that week, so the cash-out refinance product row, one product with a consistent borrower profile, is the primary comparison and the all-products row is the check. A product row is published for a decision only when at least 30 loans fall in both the before and after windows; smaller cells stay inside the all-products row. The within-a-day share is the share of locks placed less than 24 hours after the loan file was created. Lock period is the number of days requested on the lock, averaged over the window.
The period covers every completed decision from early in the year three years ago through the September hike this year, with data through October 29. The October meeting this year is excluded because its after window was still open. Decision dates and actions come from the Federal Reserve's published meeting calendar. Every rate figure is a historical average on locked loans and never an offer. Mix effects can move an average without any change in market pricing. And the figures describe AmeriSave borrowers who locked a rate, not the mortgage market as a whole.
The Bottom Line
The Fed sets an overnight rate. Your fixed mortgage rate prices off the ten-year Treasury and the spread on mortgage bonds, and both of those move on expectations weeks before the vote, so the cut is in the price before the statement prints, and the market often moves the other way on what the Fed says about next time. That's why the average rate on cash-out loans borrowers locked rose after four of the last six cuts, and why lock activity barely budged after any decision in three and a half years. A borrower who waits for Fed day to lock is buying a lottery ticket with a negative expected value. Lock when your file is ready, buy a float-down if the downside worries you, and don't pay for protection by waiting.
AmeriSave internal lock desk data, Borrower Reaction Report, locked loans around each FOMC decision since February 2023, data through October 29, 2026. Internal, not publicly available.
Board of Governors of the Federal Reserve System, FOMC meeting calendars and statements, supports decision dates and actions:
Consumer Financial Protection Bureau, "What's a lock-in or a rate lock on a mortgage?" supports rate lock mechanics and what happens if rates fall after a lock:
Freddie Mac, Primary Mortgage Market Survey, supports the statement that mortgage rates move with Treasury yields rather than the federal funds rate:


Joe brings extensive capital markets expertise to AmeriSave, specializing in pricing analysis, secondary markets, and risk oversight. He holds a B.S. in Finance from Saint Joseph's University's Haub School of Business and has managed billions of dollars in interest rate risk throughout his career with NewRez, GMAC, and Allied Mortgage Group. Based in Schwenksville, PA, he translates high-level risk and pricing mechanics into protections that benefit everyday borrowers.
Frequently Asked Questions
No. The Fed sets a target for the federal funds rate, which is an overnight rate between banks. A thirty-year fixed mortgage prices off the ten-year Treasury yield plus the spread investors demand on mortgage bonds, and both of those move on expectations about inflation and future Fed policy, not on the vote itself. The two can move in opposite directions in the same week, which is exactly what the lock desk data shows after most of the recent cuts. Fed policy shapes mortgage rates over months and years through those expectations, but on the day of a meeting the market has usually already moved on.
No, not if your file is ready to lock. After four of the last six cuts, the average rate on cash-out loans borrowers locked the following week was higher than the week before, because the cut was already priced in and the market reacted to the Fed's comments about future meetings instead. Lock activity moved less than 4% on average in either direction after cuts, holds, and hikes, so most borrowers aren't timing the meeting anyway. If you've got a closing date and a complete file, waiting a week for the vote adds risk without adding information. Lock when the loan is ready, and let the meeting happen on its own.
A float-down is an option attached to a rate lock that lets you take a lower price once, before closing, if the market improves after you lock. You usually pay for it through a fee or a slightly higher starting rate, and many versions require the improvement to clear a minimum before you can exercise it. Whether it's worth it depends on how much the premium costs against how much a realistic rate improvement would save you each month over the years you plan to keep the loan. If you'd be tempted to float unlocked waiting for a better day, the float-down is almost always the cheaper way to buy that peace of mind.
Long enough to cover your closing date with a few days of cushion, and no longer than that. Most locks run 30 to 60 days, and longer locks cost a little more because the lender is carrying market risk on your behalf for a longer period. A lock that expires before closing has to be extended at a cost, and sometimes at a worse price, so err toward a slightly longer period if your closing date is uncertain. In the lock desk data, the average lock period has shortened from about 54 days to about 43 over three years, and that drift follows product mix rather than anything the Fed did.
Because the cut was already in the price, and the market moved on what the Fed said about the next meeting. When a cut arrives with language or a forecast suggesting fewer cuts ahead than investors expected, the ten-year Treasury yield rises, mortgage-bond prices fall, and lender rate sheets reprice higher the same afternoon. The December cut two years ago is the clearest case in the data: the average rate on all loans locked the following week rose 0.41 points. The overnight rate went down, the expectation for next year went up, and your mortgage prices off the expectation, not the overnight rate.
When your file is complete enough to close inside the lock period. That means income documented, the property identified or the payoff ordered, and a realistic closing date you can cover with the lock term you choose. Roughly half to two-thirds of borrowers in the lock desk data lock within a day of starting their file, and that share held steady through every Fed decision over three and a half years. Those borrowers are hedging the way a professional would: fix the price when the deal is real, and stop trying to predict the market. If the downside still worries you, add a float-down rather than floating unlocked.